


Quick summary:
Dashboard discrepancies, where two reports show different numbers for the same metric, rarely come from bad math. The usual causes are inconsistent definitions and siloed source systems. A single source of truth fixes this in two moves. Each metric is defined once in a governed semantic model built on golden customer and product records. Automated quality checks then stop bad loads before any report refreshes. In one Azure Synapse and Power BI engagement, we consolidated eleven revenue measures into three. Metric-related support requests fell by more than half within two quarters. New-report delivery fell from about two weeks to three days.
Finance reports 1,240 new customers last month. Marketing reports 1,410 from what everyone calls the same data. The problem almost certainly sits upstream of your BI tool. There is more than one definition of a customer, and every report quietly picks its own. A Single Source of Truth for data analytics helps solve this problem by establishing consistent, governed definitions of business metrics across reports. Our team at ScriptsHub Technologies saw exactly these symptoms in a recent analytics engagement on Azure Synapse and Power BI.
The organization had more than sixty reports in production and at least four working definitions of an “active customer.” Analysts spent roughly a third of their week reconciling numbers instead of analyzing them. Our answer was fewer dashboards on a shared foundation. Metric definitions were treated as a product rather than a byproduct of reporting.
Why do dashboards show different numbers for the same metric?
Dashboard discrepancies happen because each report encodes its own business rules, and those rules drift apart over time.
One report excludes test accounts and canceled orders; another keeps them. Sales counts revenue as booked value while finance counts invoiced revenue. One report dates orders by order date, another by invoice date. A DAX measure copied into a new report six months ago never received the fix applied to the original. A SQL view joins on a column that quietly contains duplicates and inflates every total built on top of it. Each report is internally correct, which is why the discrepancy survives review.
Two structural causes sit underneath those symptoms. The first is siloed systems. The same customer lives in the CRM, the billing platform, and the ERP under different IDs. Each is refreshed on its own schedule. A report built on one system never fully matches a report built on another. The second is confusing event data with master data. Orders and payments are events, recorded once and best stored append-only. Customers and products are master data: they change over time and drift apart across systems. When a dashboard joins clean events to conflicting entity records, the totals inherit every conflict.
The cost compounds: shadow spreadsheets spread, and the data team becomes a help desk for “why doesn’t this match?” Table 1 maps the symptoms we see most often to their usual root cause.


Table 1: Common causes of dashboard discrepancies and the fix that removes each one.
What is a single source of truth in data analytics?
A single source of truth (SSOT) in data analytics is a governed layer where each business metric is defined once. Each metric is owned by a named person and reused by every report and query tool.
The SSOT principle says every data element should be mastered in only one place. That maps directly to analytics: one definition of revenue, one Customer dimension, one Date table. Lineage must also be traceable, so every dashboard can be followed back through its semantic model to its data sources. Data lineage in Power BI shows this at the item level. Quality needs checking before data reaches a report. Ownership, lineage, and quality checks form the core of data governance for an analytics team. Table 2 defines the terms used throughout this post.


Table 2: Key terms used in this post.
How do you build a single source of truth for analytics?
Five design choices make data consistency the default: golden records, centralized logic, conformed dimensions, tracked history, and pipeline tests.
Reference flow for governed analytics: source systems feed a transformation layer with a quality gate, which feeds one certified semantic model used by reports and AI query tools


Figure 1: Reference flow for governed analytics: every report and AI query tool reads from one certified semantic model.
Resolve master entities into golden records
Everything else joins to customers, products, and accounts, so fix those first. In our experience, this is the step analytics projects most often skip. Match the versions of each entity held in different systems. Apply survivorship rules that decide which system wins for each attribute. Store the result as one golden record with a key map back to every source ID. That key map lets a CRM quote, an ERP order, and a billing invoice roll up to the same customer. Larger estates use a dedicated master data management tool for this; smaller ones can handle it in the transformation layer. Avoiding duplicate copies of the underlying data helps too. Our post on centralized data management with OneLake shortcuts shows how Fabric references data in place instead of copying it.
Centralize business logic in a shared Power BI semantic model
Define measures once in a shared model and connect every report to it. Microsoft documents how reports can reuse semantic models across workspaces. Content endorsement lets you mark the governed model as certified, so analysts know which one to pick. In this engagement, consolidating eleven near-duplicate revenue measures into three governed ones removed an entire category of reconciliation questions. [[FILL-WAR-STORY: 2-3 sentences on the hardest definition fight in this engagement, e.g. which of the four active-customer definitions won, who pushed back, and what settled it]] If centralized measures slow down, our guide to Power BI DAX optimization covers the tuning.
Model around conformed business dimensions
A star schema with conformed dimensions gives every fact table the same Customer, Date, and Product. Microsoft’s star schema guidance for Power BI explains why this shape suits analytical models. Source-system quirks get resolved once in the transformation layer on Azure Synapse or Databricks instead of repeatedly inside reports. Our guide to incremental data loading in Azure Synapse covers that layer in detail.
Track history on purpose
When a customer changes region, should last year’s numbers move with it? A Type 2 slowly changing dimension keeps the old row and adds a new one. That turns the question into an explicit design decision instead of a surprise during a quarterly review.
Test data the way you test code
Analytics data quality is enforced inside the pipeline. The checks cover key integrity, uniqueness on business keys, and reconciliation against source totals. For drift that only appears between systems, see our post on data consistency across systems. The query below shows the pattern in T-SQL. It runs after the warehouse load and returns one row per failed check. If anything comes back, the orchestrating pipeline skips the semantic model refresh, so bad data never reaches a report.

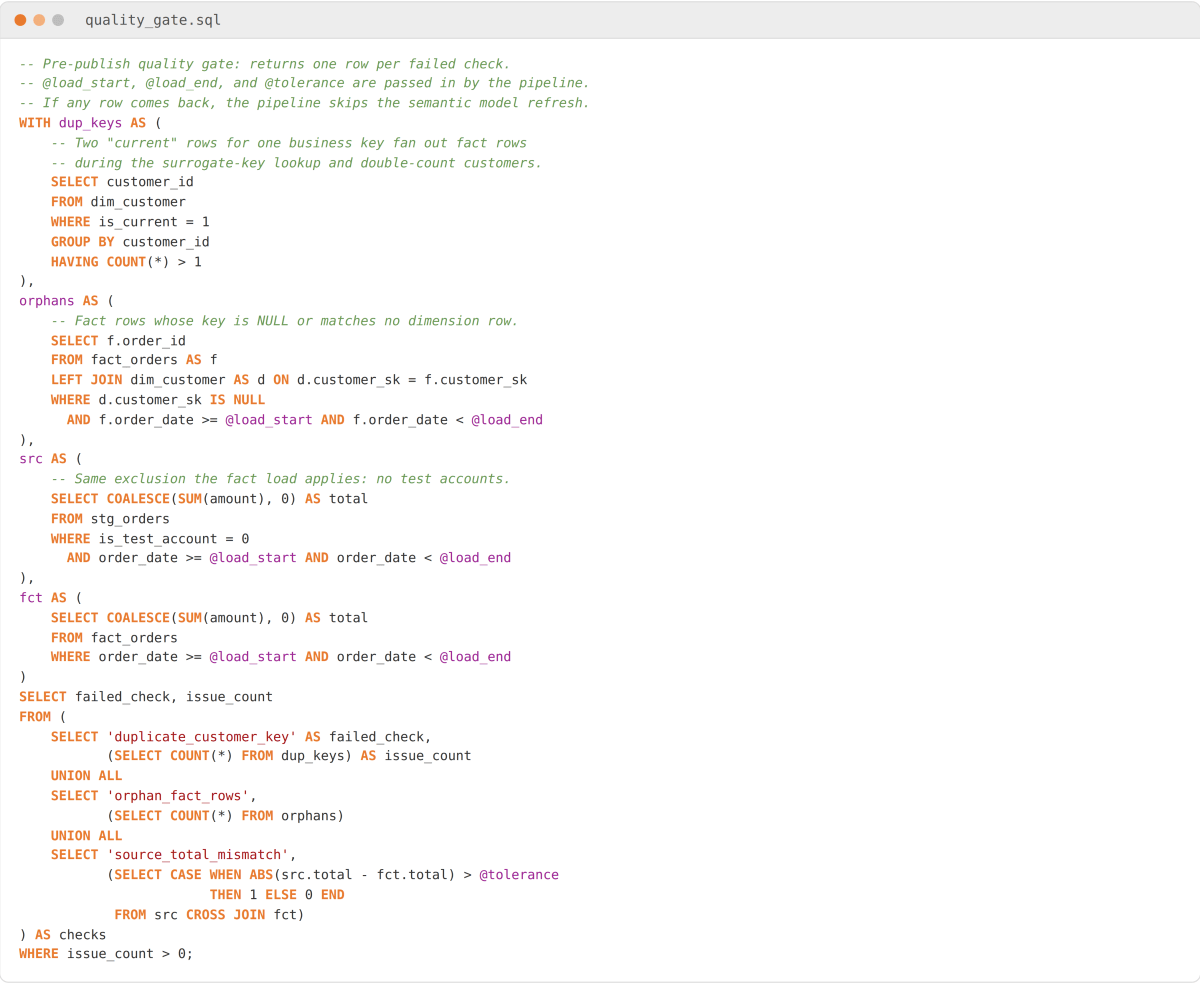
Figure 2: A post-load quality gate in T-SQL that returns zero rows when a load is safe to publish
Why this works: Each check targets a failure from Table 1. The duplicate-key test catches two current rows for one business key. Those rows fan out facts during the surrogate-key lookup and double-count customers. The orphan test uses a LEFT JOIN, so it catches keys that are NULL or match no dimension row. In Power BI those rows land under a (Blank) customer. If your load maps unmatched keys to an Unknown member row instead, count rows pointing at that member. The reconciliation compares like with like. The fact load already excludes test accounts, and both sides cover the same window. Zero rows means refresh.
How to verify it worked:Seed staging with one duplicate business key and one fact row missing its customer key. Run the load and confirm the pipeline stops before the refresh with both checks named. Rerun on clean data and confirm zero rows. On Databricks, the row-level rules map to data quality expectations in Databricks pipelines. Uniqueness and total reconciliation need expectations on an aggregate validation view, because expectations evaluate one record at a time.
Untangling dashboard discrepancies on Synapse, Databricks, or Power BI? Talk to our Power BI and data engineering consultants. We can show what a governed semantic layer would look like for your reports.
Can AI tools keep analytics metrics consistent?
AI assistants speed up analytics work. They only produce consistent numbers when they query a governed semantic model with documented definitions.
They draft SQL and DAX quickly, explain legacy queries, and document measure logic in plain language. What they lack is business context.
An assistant will happily write flawless SQL against the wrong definition of an active customer. The chart renders and the number is still off. We examined this failure in our post on text-to-SQL hallucinations. Our rule on every engagement: AI-generated SQL gets checked against the governed metric definition before it goes anywhere near production.
Intentional filters also get “cleaned up.” A WHERE clause excluding a region or date range often exists for a reason. A migration cutover or a known data gap are typical examples. Accepting an assistant’s simplification without checking the history removes a deliberate guardrail.
Natural-language query tools are only as consistent as the model underneath them. Pointed at raw tables, every question gets a slightly different answer. Pointed at a certified Power BI semantic model, assistants such as Copilot in Power BI become a genuine accelerator. They inherit the same measures every report already uses. As of November 2026, Copilot needs paid Fabric (F2 or higher) or Power BI Premium (P1 or higher) capacity.
What changed after the metrics were consolidated?
Within two quarters, metric-related support requests dropped by more than half. The time to deliver a new report fell from about two weeks to three days.
[[FILL-CLIENT-QUOTE: one anonymized line from the client sponsor, attributed by role and industry only, with written permission]]
The faster delivery came from reuse: a new dashboard became assembly work on an existing model. The drop in support requests tracked the measure consolidation and the automated quality checks. Together they removed the most common causes of mismatched totals. To measure data consistency gains in your environment, start tracking metric-related tickets per month and request-to-release time before the rebuild. That gives you a baseline.
What workflow keeps dashboard numbers consistent?
A six-stage data governance workflow keeps numbers aligned: map data, define metrics, model once, validate, document, and retire unused reports.
Map where the data lives. List every system holding core data: the CRM, billing, the ERP, and the spreadsheets nobody admits to. Note what each records and how often it syncs. That inventory shows where the same entity or metric is being produced twice.
Define before you build. Bring business owners and the data team together and agree on each metric in writing before any SQL is written. Capture the formula, what it includes and excludes, its date basis, and who owns it. Table 3 shows the record we keep for every governed metric. Thirty minutes aligning on what churn or conversion means saves weeks of reconciliation later.


Table 3: An example metric definition record, agreed in writing before any SQL or DAX is written.
Model once, report many times. Build conformed dimensions and shared measures first, then let reports consume them.
Validate inside the pipeline. Automate analytics data quality checks at every layer so no stakeholder is ever the first to spot a broken number. Late-arriving records are a common blind spot. Our case study on late-arriving data in incremental loads shows how they get skipped silently.
Record why each rule exists. Write short notes on why refunds are netted in the month issued or why test accounts are excluded. Those notes grow more valuable every time the team changes.
Retire reports by usage data. Review Power BI usage metrics monthly and decommission what nobody opens. In our experience, a single usage review retires a meaningful share of a report estate.
Conclusion: agree on the number before you chart it
AI and self-service BI make data governance more important, because inconsistent definitions now surface in days instead of quarters.
Trusted analytics still depends on one thing no tool can automate. Someone has to agree on what a number means before it appears on a dashboard.
Where to start this week. Pick the metric that causes the most arguments, usually revenue or active customers. Map every system and report that produces it. Then write its definition down using the fields in Table 3 and have the business owner sign off. Those two steps take a few hours, and they expose most of the gaps a full SSOT program would close.
If you want a second pair of eyes, send us two dashboards that disagree. Our data analytics consulting team will trace where the numbers split. Then we show what an SSOT would change for your reporting.
Frequently asked questions
Q. What is a single source of truth (SSOT) in data?
A single source of truth (SSOT) is a data management practice. Each critical data element and metric is maintained in one authoritative, governed place. This ensures everyone makes business decisions based on the exact same, verified data.
Q. Why do my dashboards show different numbers?
Dashboards disagree due to siloed data sources, mismatched KPI definitions, and inconsistent filters. When different departments use separate systems or distinct formulas for the same metric (like revenue), it creates conflicting reports.
Q. How do you create a single source of truth?
Build an SSOT by integrating data into a central warehouse or lakehouse and standardizing metric definitions across teams. Add master data management (MDM) and a semantic layer to feed consistent data to all BI dashboards.
Q. What is the difference between SSOT and MVOT?
An SSOT provides one authoritative source for core data, ensuring consistency. A multiple versions of the truth (MVOT) approach lets departments view that same data tailored to their own operational contexts.
Q. Do you need to replace Power BI or your warehouse to build an SSOT?
No. Most of the work sits in the data model and the metric definitions. An existing warehouse and Power BI tenant can usually be restructured around conformed dimensions and a shared semantic model.
Q. Can you start a single source of truth with just one metric?
Yes. Start with the most disputed metric, write down its definition, and build it once in the shared model. Each metric you add afterward reuses the same dimensions and quality checks.
About ScriptsHub Technologies
ScriptsHub Technologies is a data engineering and applied AI consultancy with teams in the US, UK, and India. We build data platforms on Azure Synapse, Databricks, and Microsoft Fabric, design governed Power BI semantic models, and help organizations get to analytics their leadership can trust. Learn more at scriptshub.net.