

QUICK SUMMARY –
A retail analytics dashboard took roughly 45 seconds to render one page, and the regional managers had gone back to Excel. The fix was not more capacity or less data. Our team at ScriptsHub Technologies profiled the report, found most of the wait was formula engine time from two measure patterns, and rewrote them in an afternoon. Page load dropped to under five seconds. This case study covers the diagnostic order we use for Power BI DAX optimization, two widely repeated rules that are wrong, and how to run the pass yourself. Your own gains will depend on model size, cardinality, and visual count.
Why Is My Power BI Report Slow When the Dataset Is Small?
If a report page takes 30 seconds or more to render, your fact table is only a few million rows, and a larger capacity changed nothing, the bottleneck sits in your measures. They are asking the engine to do too much with the data, which puts this squarely in Power BI DAX optimization territory.
Those were the exact symptoms our Power BI consulting and data analytics team met on a recent engagement with a multi-site retail group in the UK. Their flagship sales dashboard carried more than a dozen visuals and measures that read perfectly well. Adoption had collapsed anyway.
The measures were not badly written in any obvious way. They were written the way most analysts write DAX coming from SQL, and that instinct generates the wrong query plan.
Formula Engine vs Storage Engine: Which One Is Slowing Your Report?
Formula engine time points at your DAX. Storage engine time sends you to the model. Get that wrong and you can spend a week on a formula worth 200ms of a 40-second page.
The Power BI Performance Analyzer records how long each visual takes and splits that time into DAX query, visual rendering, and other. Start there, then copy the DAX query from the slowest visual into DAX Studio and read the server timings. That second read is the one most teams never do, and it is the same breakdown Microsoft sets out in its guidance on how to monitor report performance.
High formula engine time means logic is being evaluated in a single-threaded path while the storage engine sits idle. The storage engine is multi-threaded and vectorized, so the same work costs far less there. That asymmetry is what Power BI DAX optimization comes down to. That is a DAX problem, and rewriting the measure will fix it. High storage engine time with low cache hits means the engine is scanning more data than it should, which is usually a model problem: a missing star schema, bidirectional filters, or high-cardinality slicer columns.

The diagnostic order we run before touching a single measure.
On the retail dashboard, roughly four-fifths of query time sat in the formula engine. That single reading scoped the whole engagement. We booked an afternoon and left the model alone.
CALCULATE vs FILTER Performance: Which Patterns Cost the Most?
Two patterns cost the most: FILTER wrapped around a whole table inside an iterator, and an expensive expression evaluated twice where a variable would hold it. Between them they accounted for most of the formula engine time here.
Take the first. FILTER returns a table, so in most plans the engine materializes every qualifying row and walks it. The optimizer can sometimes push a simple predicate down, which is why step 3 says re-measure after each rewrite:
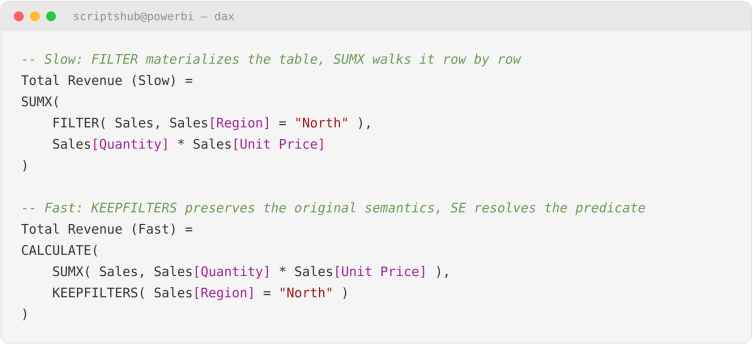
Why this works: a predicate passed to
CALCULATEbecomes a filter over one column’s distinct values, which VertiPaq resolves against compressed column segments.FILTERworks at table granularity instead, testing the condition across rows, and that cost scales with row count. Microsoft’s guidance coversFILTERas aCALCULATEfilter argument; the sample above uses it asSUMX‘s table argument. Different position, same reason to avoid it.
Do not drop KEEPFILTERS. Microsoft documents that CALCULATE overwrites existing filters on any column named in its predicate, so on a report with a Region slicer the bare rewrite quietly changes your results. FILTER intersects with the current context; KEEPFILTERS makes CALCULATE behave the same way.
The second pattern repeats an expensive sub-expression that a variable could hold:
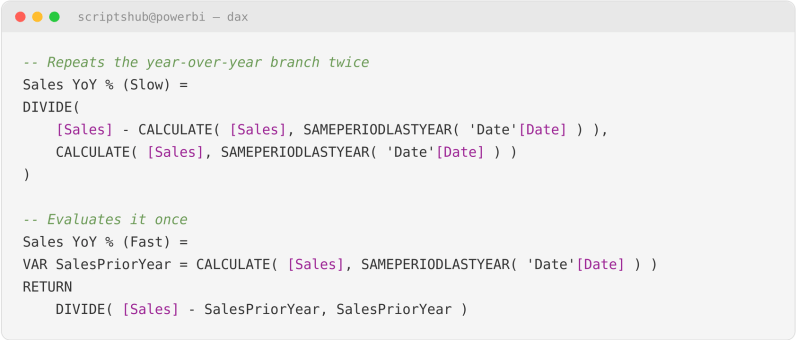
Why this works: DAX variables performance comes from single evaluation. A variable is computed once per context and reused, which is why Microsoft’s DAX best-practice guidance recommends variables for performance as well as readability. The VAR keyword reference documents the same behavior.
When it matters: the storage engine caches identical scans within a query, so duplicating a plain SUM costs far less than claimed. Expect a speed-up only where the repeated work is expensive.
If you cannot tell whether the problem is your DAX or your model, that is what the audit settles. See what a fixed-scope Power BI performance audit covers →
Does DIVIDE() Always Beat the “/” Operator in DAX?
No – and this is the advice we most often have to unwind. The DIVIDE function is the right default when the denominator could return zero or blank, because it handles that without a conditional test.
But Microsoft’s own guidance is explicit that when the denominator is a constant, the divide operator performs better, because the division is guaranteed to succeed and the extra safety test is wasted work. There is a second catch: DIVIDE() always executes in the formula engine, so in a measure that would otherwise resolve in the storage engine, reaching for it reflexively costs cache reuse.
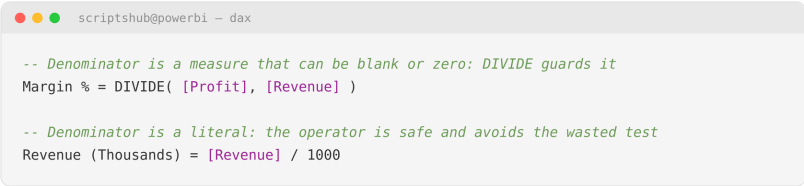
The rule we apply:
DIVIDE()when the denominator is a measure or column; the operator when it is a literal. Adopt either blanket rule, alwaysDIVIDE()or always the operator, and you will slow a report down while believing you sped it up.
Do Chained Measures Slow Down Power BI Reports?
Not by themselves – the other myth worth retiring. Measure chaining gets blamed for phantom overhead in optimization checklists, but a measure reference is expanded by the engine before the query plan is built. Referencing [Base Sales] inside [Adjusted Sales] adds no evaluation pass.
The cost sits in context transition. Call a measure inside a row context, whether in SUMX or wrapped in CALCULATE, and the engine converts that row into a filter. Repeat that across a large table and it gets expensive. The problem is the transition, not the reference. Where an iterator is unavoidable, shrink the table you hand it first.
Keep your chains: flattening a well-factored library into duplicated logic buys nothing and makes every later change harder. Look for iterators calling measures over big tables instead. That is where the time goes.
Should You Replace COUNT With COUNTROWS?
Usually, and Microsoft’s reference agrees. But the stated reason, that it is faster because the storage engine skips blanks, misses what actually changes. COUNT counts non-blank values in one column; COUNTROWS counts rows in a table. On a column containing blanks they return different numbers, so the swap is a semantic change wearing a performance costume, the same trap as dropping KEEPFILTERS.
COUNT also ignores text, so COUNT(Customers[Name]) returns blank instead of a customer count.
What Did This Power BI DAX Optimization Deliver?
We changed no relationships and left the report layout untouched. The rows below are the two measure groups we rewrote. Figures are from this engagement only.

Those numbers do not add up. Query time fell by 23 seconds while the page improved by 40. Visuals share a single UI thread, so reported durations include time spent waiting on other operations. Removing 23 seconds of query work removed roughly 17 seconds of queueing with it.
Regional managers were back on the dashboard within two weeks, the only adoption measure anyone asked about.
How Do You Run a Power BI DAX Optimization Pass on Your Own Report?
Here is how to optimize DAX measures on a report you have never opened. Work in order; each step narrows what the next examines.
- Record a baseline. Performance Analyzer, full page refresh, cold cache. Export the log to prove the improvement.
- Split the time. Copy the slowest visual’s DAX query into DAX Studio and read server timings. Microsoft’s slow Power BI report troubleshooting flowchart branches the same way. DAX Optimizer sweeps a whole model rather than one query. If the formula engine dominates, rewrite measures; if the storage engine dominates, look at the model first.
- Fix the top offender only, then re-measure. Batching six rewrites tells you the page got faster but not which change did it.
- Hunt the two patterns.
FILTERover full tables inside iterators, and expensive expressions evaluated twice where a variable would serve. - Check your date table. Turn off Auto Date/Time, or Power BI builds a hidden date table behind every date column. Time intelligence needs one contiguous table marked as a date table; gaps break it. Joining on a datetime column instead of a date column inflates cardinality and slows every scan touching it.
- Stop when the page is fast enough. A 3-second page nobody complains about need not be a 2-second page.
When Should You Stop Tuning Measures and Look at the Model?
Power BI DAX optimization has a boundary. Suppose your measures are clean, the numbers trustworthy (a separate battle, covered in schema drift in Azure Data Factory), and the page still slow. What remains is architectural: many-to-many relationships forcing expensive plans, or a fact table that needs an aggregation layer. Those are worth making, but they are a different size of project, and different again outside Azure, as in our connect Power BI to AWS Athena and S3 walkthrough.
DAX is sometimes not the culprit at all. When the complaint is a refresh running for half an hour, the problem is usually business logic in the wrong layer. Our case study on fixing Power BI slow refresh by pushing logic upstream covers that case.
Fix your slow reports properly. ScriptsHub Technologies runs fixed-scope Power BI performance audits on a single workspace: we settle whether the problem is your DAX or your model, and return a prioritized fix list within a week. Talk to our data team →
Frequently Asked Questions
Q. Why is my Power BI report slow?
Usually the measures themselves. Power BI DAX optimization targets the formula engine, where badly shaped calculations spend most of their time. Open Performance Analyzer first: when a visual’s DAX query time dwarfs its rendering time, start with the measures.
Q. How do I know if it is a DAX problem or a data model problem?
Run the slowest visual’s query in DAX Studio and read server timings. Time dominated by the formula engine means the DAX is at fault and rewriting the measure fixes it. Storage engine time with poor cache reuse means the model.
Q. Is CALCULATE faster than FILTER in DAX?
For simple column conditions, yes. A CALCULATE predicate filters one column’s distinct values against compressed segments; FILTER works at table granularity, testing every row. Wrap the predicate in KEEPFILTERS, or CALCULATE overwrites existing slicer filters and changes your numbers.
Q. Should I always use DIVIDE() instead of the / operator?
No. Use DIVIDE() when the denominator is a measure or column that could be zero or blank. When it is a constant, Microsoft recommends the operator: the safety check is wasted work, and DIVIDE() always evaluates in the formula engine.
Q. Should I use COUNTROWS instead of COUNT?
Yes for counting rows, and Microsoft recommends it. But they are not interchangeable. COUNT returns non-blank values in one column and ignores text entirely; COUNTROWS returns every row. Swap them on a column containing blanks and your numbers change.
Q. Do chained measures slow down Power BI reports?
Measure chaining costs nothing by itself. The engine expands measure references before building the query plan, so a reference adds no evaluation pass. The real cost is context transition: a measure called inside SUMX or CALCULATE over a large fact table.


